Clear picture of the processes which flow in the country in regard to the production and transformation of energy and energy sources and their consumption by the separate economic sectors presents the general energy balance, issued annually by the National Statistic Institute.
The following developments could be noticed in 2016:
- The generation of primary energy from renewable fuels reached its historic peak of 925 ktoe
- The export of petrol products also marked a historic record of 4621 ktoe
- The import of coals was almost 5 times less than the one in 2001 and for consecutive year it made a remarkable fall reaching the lowest level of 495 ktoe
- Energy consumption of transport sector kept on growing for a third year in row reaching 3348 ktoe
- After five years in row of fall the final consumption of heat energy touched historic bottom of 782 ktoe
- Improvement of general indicators related to more efficient consumption of energy and energy products by the national economy
A look to the production, import and export of primary energy
The production of primary energy in the country was 10757 ktoe as coals traditionally continued to have a dominant share of 47,2% in it, followed by the nuclear energy with share of 37%. For sixteen years the production of primary energy from renewable fuels and wastes (mainly solid biomass) increased two times and a half. Respectively, their share in production of primary energy grew from 5,1% in 2001 to 8,6% in 2016. Although being presented with negligible amount heat energy from RES was growing steadily in the recent eight years. This energy has been reported as a separate component in the energy balance since 2008. Then it was 33 ktoe and in 2016 it was 73% more.
The import of energy and energy resources for a third year in row went on to 12764 ktoe but it remained far away from the statistic record in the new millennium of 15082 ktoe. The petrol and petrol products encompassed 71% of the import and the natural gas participated by 20%. Substantial change occurred in the import of coals which had started since 2008. Latest largest import of coals in the new millennium was realized in 2007 – 2877 ktoe and the next year it fell by more than 1000 ktoe. In 2016 the coal import went down to its lowest level of 495 ktoe.
A look to the consumption
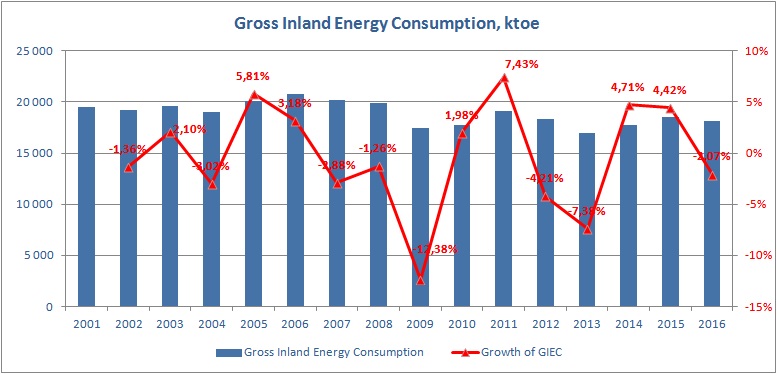
After two years of over 4% growth the gross inland consumption of energy marked decrease of 2,07% to 18152 ktoe.
Source: NSI
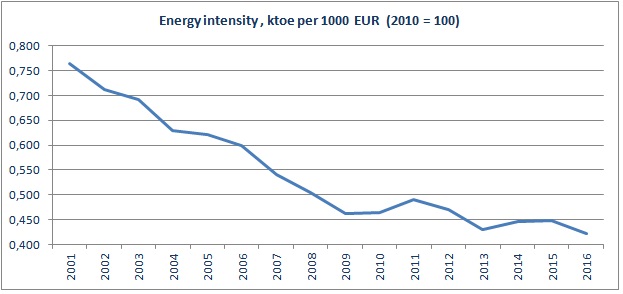
In the same time the economy of the country carried out a growth of 3,94% of GDP (2010 =100). One of the indicators of energy efficiency of the country is energy intensity or how much energy and energy resources are necessary per unit produced product. In 2016 there was an improvement of this indicator which was 0,423 ktoe per 1000 EUR (2010=100). Twenty years ago it was 0,951 ktoe per 1000 EUR according to Eurostat’s data but although the progress made it has remained far away from the current average EU level of 0,120 ktoe per 1000 EUR (2010=100) and 0,116 ktoe per 1000 EUR (2010=100) for the European area.
Source: Eurostat and EMI calculations
Other important indicator which marked progress was the proportion of final to gross energy consumption. In 2016 it was 52,4% and in the distant 2001 was 44%. Closer to 100% this indicator is the lesser are the transformation and transmission energy losses.
The final non-energy consumption decreased from 605 ktoe in 2015 to 494 ktoe in 2016. The reason of this 18% fall of non-energy consumption was the reduced over two times consumption of petrol products from “other sectors” (different from chemistry industry). On the other hand the final non-energy consumption of natural gas from chemistry industry increased by 5%.
For a third consecutive year the final energy consumption went up to 9517 ktoe- a relatively high amount which was near the record of 9880 ktoe ten years ago.
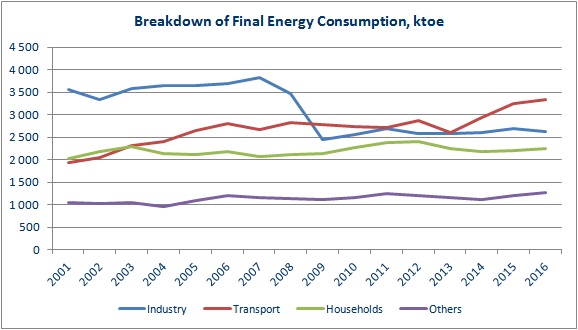
Regarding the breakdown of the final energy consumption by economic sectors there were no significant surprises. All sectors consumption grew except the industry.
Since 2013 the transport sector had increased in a rush its advance to the industry and it performed a new record of 3348 ktoe in 2016. This sector consumed mainly petrol products as the last year the consumption amounted of 3059 ktoe or by 1159 ktoe more than the one in 2001.
Industry reduced its energy consumption by 2,5% due to the decreased consumption of the largest consumer-chemistry industry (-4%), other industries which succeeded to cut down their final energy and energy resources consumption were the food industry (-4,1%), wood&wood products (-6,5 %), non-ferrous metal industry (-2,3%), mining and quarrying industry (-0,9%) and paper, pulp and print (-0,4%). A growth of 4,9% in the final energy consumption marked non-metallic minerals. In regard to the energy and energy resources which industry used main reason for the fall of the final consumption was the decreased consumption of heat energy.
Source: NSI
Since 2008 the households steadily increased its consumption except 2013 and 2014. Final energy consumption of households in 2016 was 2262 ktoe or a growth of 2,2%. The electricity and renewable fuels and wastes continued being the most preferable form of energy by the households – respectively 923 and 758 ktoe. This value of the renewable fuels and wastes repeated the peak in 2012. In the recent three years the households has increased their coal consumption as in 2016 there was a growth of 10%. The consumption of natural gas of household was 59 ktoe or a growth of 2,36 times for a ten year. The consumption of heat energy by the households was 325 ktoe- a fall of 2,4%.
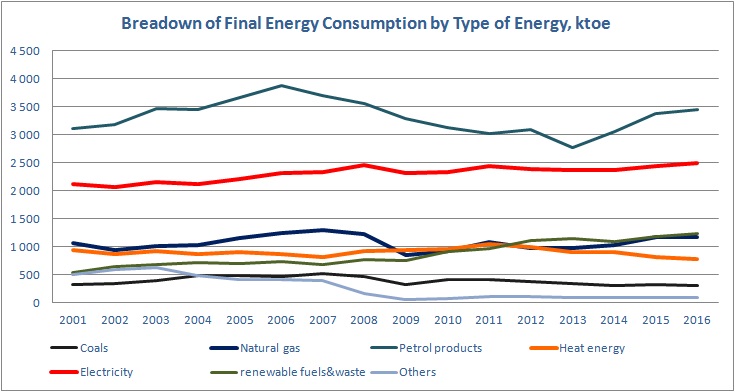
Source: NSI
NSI’s data for the final energy consumption by type of energy show decreased of the consumption of coals and heat energy respectively by 3.75% and 4.28%. For heat energy this means a decrease for five year in row -782 ktoe, the lowest level since 2001. There was an increase of final consumption of petrol products ( 2,22%), electricity (2,06%).